Sustainability Indicators

Measuring Industry Contribution to Sustainable Development
Copper Alliance® members publish sustainability metrics that are collectively analyzed by ICA. Developing this analysis on a global scale allows the industry to identify areas for benchmarking and collective action for sustainable development.
The eight indicators chosen are aligned with the Global Reporting Initiative, which provides a consistent, well-recognized methodology for reporting. Participating members are voluntarily submitting their data and represent between 40 – 50 percent of global annual copper production.
Facts and Figures
CO₂ Emissions
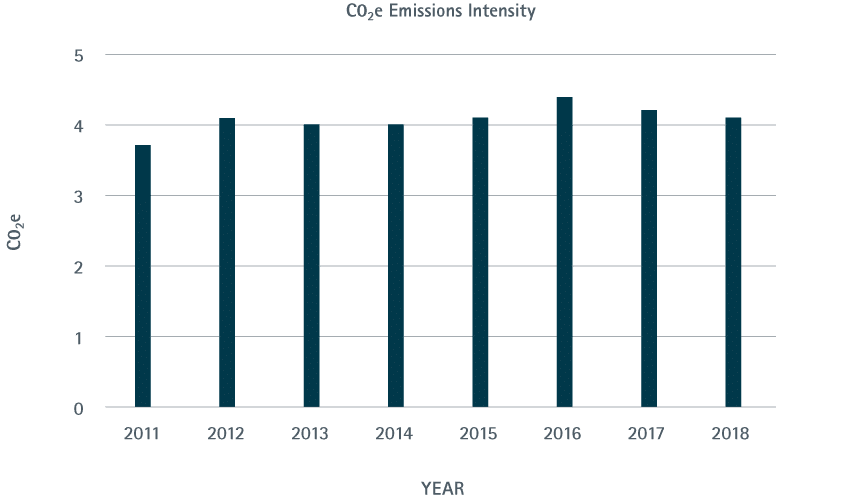
Copper Alliance® members are taking action to reduce CO2 equivalent emissions in their operations. Look at Rio Tinto’s move to solar energy, Codelco’s first hybrid loader, and Anglo American’s photovoltaic plant built over mine tailings for a few examples in practice.
To learn more about the sources of these emissions and the opportunities the industry has for lowering this intensity value, see ICA’s Copper Environmental Profile.
Energy
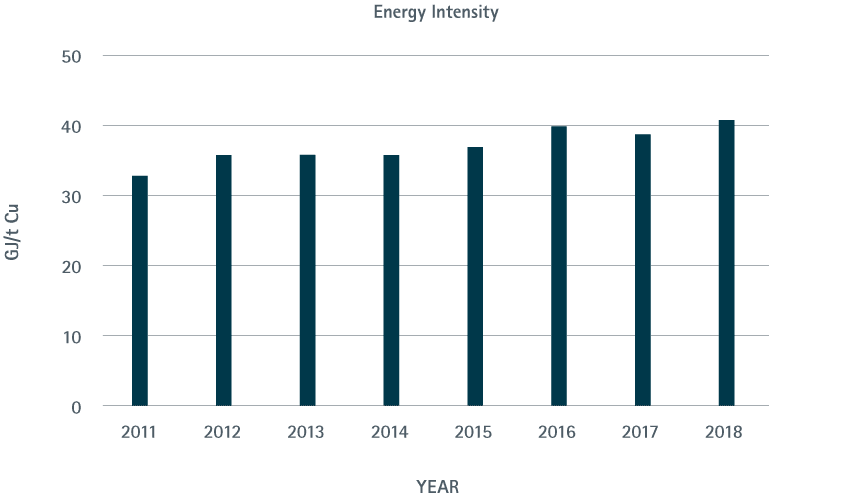
Energy intensity per tonne of finished copper product was 41 GJ in 2018. Many factors, such as the age of a mine, the ore grade, and processing technology have an impact on energy intensity. Adopting artificial intelligence allowed Freeport-McMoRan to increase production and efficiency at their Bagdad and Morenci projects, which is just one of the ways Copper Alliance® members are improving energy efficiency.
Life Cycle thinking
It is worth noting that the energy required during the production phase of copper's life cycle is often offset during the use phase. A vast majority-70 percent-of copper goes to electrical end-use applications because it is the most efficient nonprecious conductor of heat and electricity. Copper in electrical systems can deliver a lifetime savings of 100 to 7,500 tonnes of CO2 equivalent emissions and save users between $25,000 and $2.5 million in reduced energy costs [source].
Water
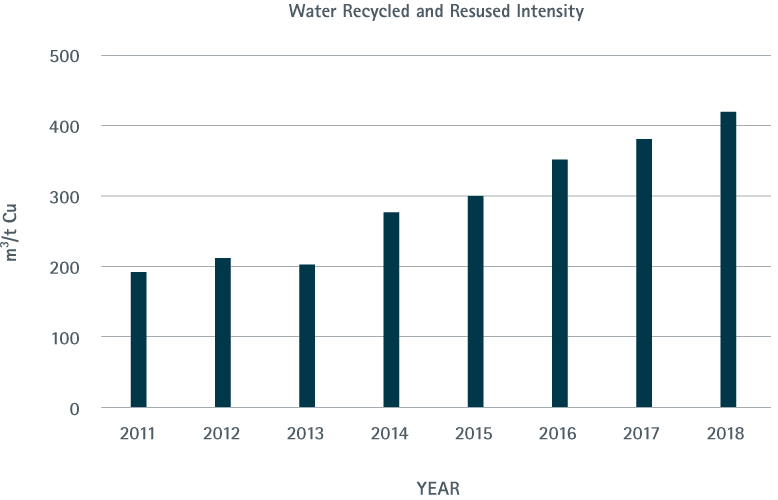
On average in 2018, water was used at least twice before exiting production sites. Copper Alliance members surveyed demonstrate continued positive progress in the amount of water they are able to recycle and reuse during copper production.
For an example of the steps companies are taking to reduce the amount of freshwater they consume, take a look at the new desalinization plant at BHP's Escondida mine.
ICA encourages all of its mining members to use the A Practical Guide to Water Reporting produced by ICMM.
Distribution
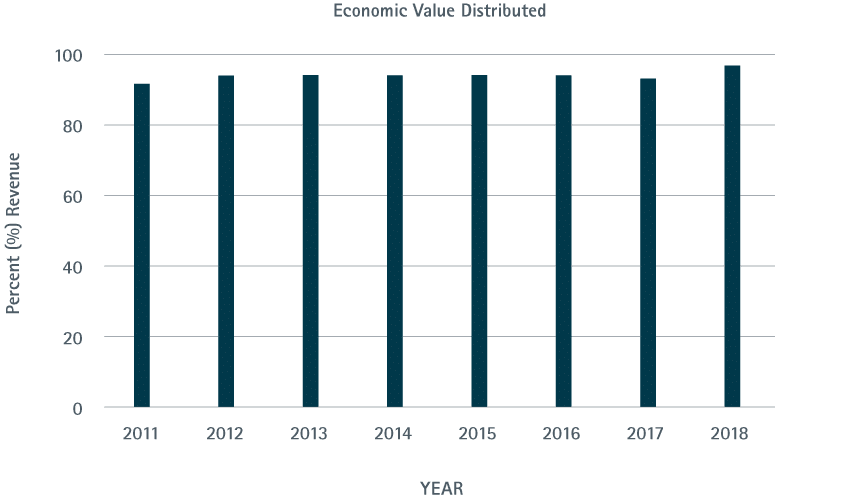
On average, the Copper Alliance members surveyed feed $107 billion per year into the global economy. In 2018, 97 percent of the revenue was redistributed in the form of wages, operating costs, financing, and investing in local community development.
Investment
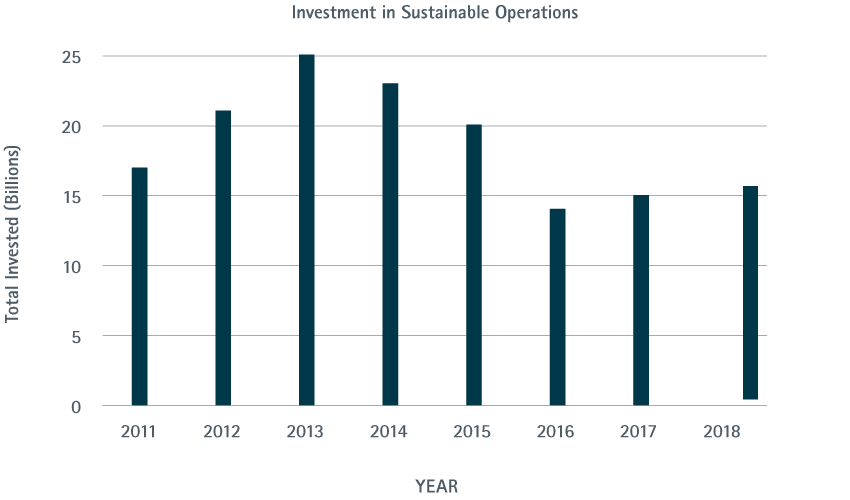
On average, the Copper Alliance® members surveyed invest $19 billion every year to improve their contribution to sustainable development. This includes spending on protection of the environment and improving the safety of operations.
For example, a three-year project at Boliden's Aitik mine increased the lifespan of their system five-fold and the efficiency of their operation.
Employment
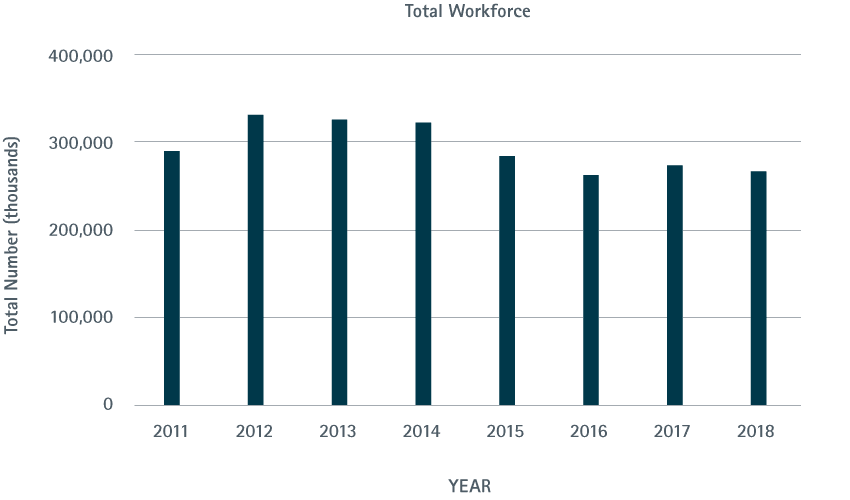
The Copper Alliance® members surveyed employ nearly 300,000 people on average per year. This does not include the hundreds of thousands of jobs created by the industries using copper. In Chile - where 30% of the world's copper is mined - it is estimated that for each job in a copper mine, 3.7 jobs are created in other sectors of the economy. For a comprehensive assessment of the socioeconomic impact of copper mining on the workforce in Chile, see this 2017 analysis.
Safety
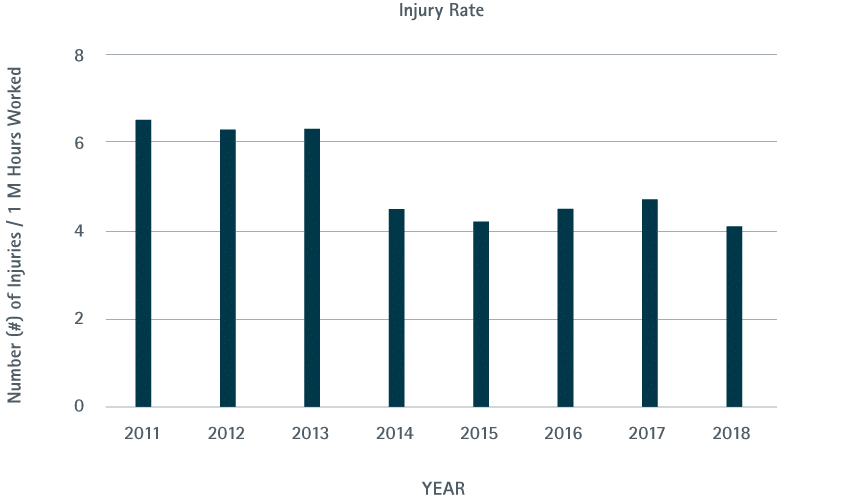
Between 2013 and 2014 the Copper Alliance® celebrated a reduction in the injury rate by members surveyed. Significant investment in equipment and training, as well as industry-wide use of the OHSAS 18001 (industrial safety and health protection) certification has driven progress on this indicator.
Moving forward, the industry focusing on behavior-based safety. ICMM hosts a leading dialogue on safety, where many Copper Alliance members collaborate to drive zero harm.
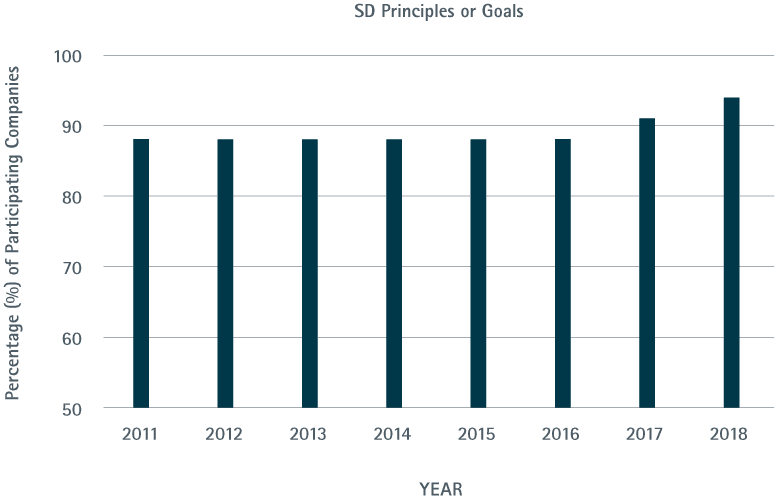
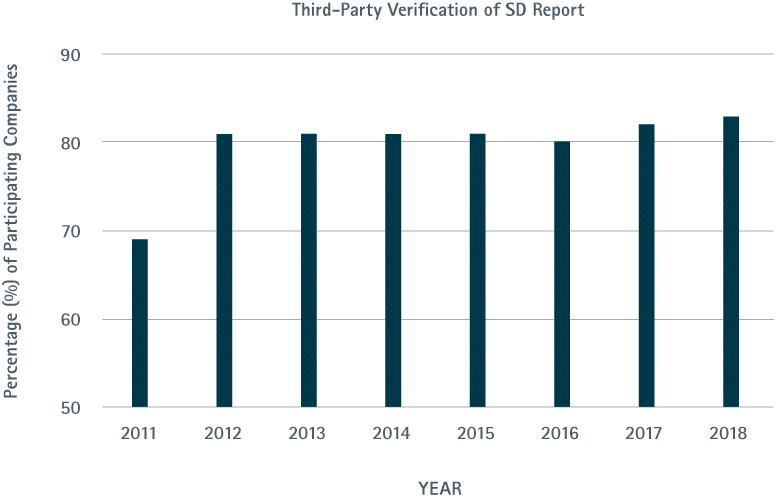
Sustainability Reporting
The majority of Copper Alliance® members surveyed are committed to reporting their information with third party verification in the spirit of transparency and collaboration.
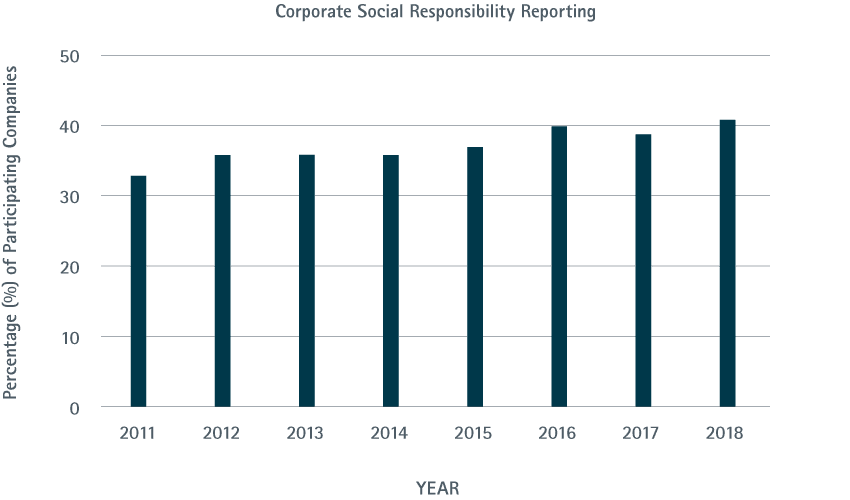
To learn more about how the indicators are calculated, download the methodology.
Participating Companies
Our members rated their performance against a range of indicators. The following members responded:


Sustainability is at the core of ICA’s mission, and the Copper industry is united in its efforts to develop and operate in a more sustainable manner.
Learn how the copper industry’s operations and programs align with the UN SDGs.
